I have had a paranoia about the reliability of nylon monofilament lines since the early 1950’s when I was given a spool of the, then revolutionary new fishing line, Luron2, from ICI. After only a few weeks the stuff started to degrade, a white, powdery substance forming on the surface. Whenever I saw this powder I washed the line in fresh water and all seemed well with the world again. After a couple of months I hooked into the biggest fish I had ever had on my line, a tench of about a pound or so. Not having a landing net I played the fish carefully and tried to lift it out. Despite having a (weaker) gut hook link the infamous Luron2 parted just below my hand and I had to watch as the tench slowly righted itself and swam back into the deeps trailing hook to gut and about a foot of the now hated mono.
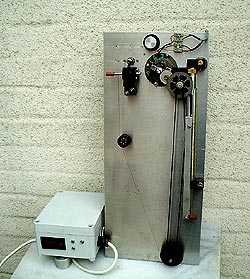
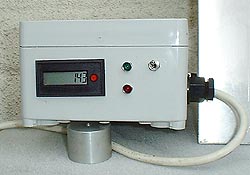
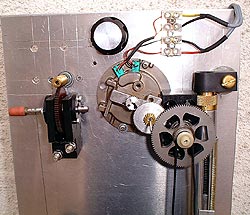
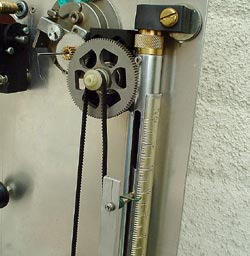
Early tests with cables ties and a spring balance Some years after this I became the proud possessor of a cheap spring balance – I never caught anything big enough to weigh but it was useful for checking the strength of the lines. This state of affairs continued until the 1970’s when I felt that something a bit more sophisticated was required. After much tearing of hair I had a brainwave. Nylon cable ties were then coming into general use, so I fixed a cable tie to the hook on the spring balance, ran the tie through another tie and tied the line to be tested to the end of the first cable tie. With the second tie fixed firmly to the shed door, the line was pulled to breaking point and the spring balance was prevented from retracting by the locking action of the cable ties. Brilliant thought I. But there was a drawback, every time you tested a line you needed two new ties. I got over this by using the pawl and spring from an old, broken cable tie gun that I recovered from the scrap bin at work. This system worked admirably for about 20 years but as time went on I felt that more improvements (giving better repeatability) were needed. Then spring movement was measured A couple of years ago I started toying with the idea of retaining the spring balance but instead of reading the break point straight from the scale I could measure the actual movement of the spring. I did this by removing the pointer from the scale and fixing a piece of angle alloy to the barrel of the spring balance, at the top by using the tapped hole vacated by the pointer and at the bottom via a fabricated clamp. To the alloy I fixed a miniature toothed belt scavenged from an old printer. As the barrel descends, the toothed belt turns a pulley connected to an electronic pulser scavenged from an old flow meter. The pulser output is connected to some electronics trickery with the final output going directly to an LCD display showing the exact (to 2 decimal places) breaking point in kilos. This figure is held until a reset button is pressed. Repeatability, on a good sample, is usually to within a couple of hundredths of a kilo. This is a vast improvement over the old system where repeatability was never better than about 0.2 of a kilo. Accuracy is equal to the accuracy of the spring balance, a good quality Salter tubular balance of 10lb range x 0.1 lb resolution.
The electronics were adjusted by using known weights (1kg bags of Sugar) and calibrating accordingly. I don’t know the accuracy of the whole system (when in use) but would be very surprised if it is not better than plus or minus 1/2 %. I am an Instrument Technician by trade and am used to calibrating other measuring devices to within + or – 0.1%. Data is for information only This is how the system remains today and how I obtained the following data. This data is for information only and I’ll leave you to draw your own conclusions. This data is not of very much general use due to the hodgepodge of lines that I had available to test. It served its purpose for me at the time. The most useful thing (to me) is the ‘index of strength’ figure which allows you to compare different lines of different BS’s and arrive at a comparison. If you look at the control data you’ll see that the ‘index of strength’ seems to reduce as the line gets thicker, I can’t explain this. If I can get some more manufacturer’s data it would be interesting to see if this trend is repeated. If so it may be due to some error in my maths, (feel free to check it yourself) if it proves to be a peculiarity of the material it may be worth including a correction figure into the equation to compensate for this.
Data on this page is taken from the Bayer web site www.bayerfaser.com and is only intended as a control table to test the validity of my ‘index of strength’ figure. | ||||||||||||||||||||||||||||||||||||||||||||||||||||||||||||||||||||||||||||||||||||||||||||||||||||||||||||||||||||||||||||||||||||||||||||||||||||||||||||||||||||||||||||||||||||||||||||||||||||||||||||||||||||||||||||||||||||||||||||||||||||||||||||||||||||||||||||||||||||||||||||||||||||||||||||||||||||||||||||||||||||||||||||||||||||||||||||||||||||||||
| ||||||||||||||||||||||||||||||||||||||||||||||||||||||||||||||||||||||||||||||||||||||||||||||||||||||||||||||||||||||||||||||||||||||||||||||||||||||||||||||||||||||||||||||||||||||||||||||||||||||||||||||||||||||||||||||||||||||||||||||||||||||||||||||||||||||||||||||||||||||||||||||||||||||||||||||||||||||||||||||||||||||||||||||||||||||||||||||||||||||||
| ||||||||||||||||||||||||||||||||||||||||||||||||||||||||||||||||||||||||||||||||||||||||||||||||||||||||||||||||||||||||||||||||||||||||||||||||||||||||||||||||||||||||||||||||||||||||||||||||||||||||||||||||||||||||||||||||||||||||||||||||||||||||||||||||||||||||||||||||||||||||||||||||||||||||||||||||||||||||||||||||||||||||||||||||||||||||||||||||||||||||
| cross sectional area (csa) = Pi*((Dia/2)*(Dia/2)) index of strength (i.o.s.) = B.S in kilos/csa
| ||||||||||||||||||||||||||||||||||||||||||||||||||||||||||||||||||||||||||||||||||||||||||||||||||||||||||||||||||||||||||||||||||||||||||||||||||||||||||||||||||||||||||||||||||||||||||||||||||||||||||||||||||||||||||||||||||||||||||||||||||||||||||||||||||||||||||||||||||||||||||||||||||||||||||||||||||||||||||||||||||||||||||||||||||||||||||||||||||||||||
| Data on this page was obtained from lines that I considered too old to be reliable OR had proved to be un-reliable. | ||||||||||||||||||||||||||||||||||||||||||||||||||||||||||||||||||||||||||||||||||||||||||||||||||||||||||||||||||||||||||||||||||||||||||||||||||||||||||||||||||||||||||||||||||||||||||||||||||||||||||||||||||||||||||||||||||||||||||||||||||||||||||||||||||||||||||||||||||||||||||||||||||||||||||||||||||||||||||||||||||||||||||||||||||||||||||||||||||||||||
| ||||||||||||||||||||||||||||||||||||||||||||||||||||||||||||||||||||||||||||||||||||||||||||||||||||||||||||||||||||||||||||||||||||||||||||||||||||||||||||||||||||||||||||||||||||||||||||||||||||||||||||||||||||||||||||||||||||||||||||||||||||||||||||||||||||||||||||||||||||||||||||||||||||||||||||||||||||||||||||||||||||||||||||||||||||||||||||||||||||||||
| ||||||||||||||||||||||||||||||||||||||||||||||||||||||||||||||||||||||||||||||||||||||||||||||||||||||||||||||||||||||||||||||||||||||||||||||||||||||||||||||||||||||||||||||||||||||||||||||||||||||||||||||||||||||||||||||||||||||||||||||||||||||||||||||||||||||||||||||||||||||||||||||||||||||||||||||||||||||||||||||||||||||||||||||||||||||||||||||||||||||||
Data on this page was arrived at by testing new or nearly new lines OR lines that I had previously tested crudely and that I was happy to continue to use.
| ||||||||||||||||||||||||||||||||||||||||||||||||||||||||||||||||||||||||||||||||||||||||||||||||||||||||||||||||||||||||||||||||||||||||||||||||||||||||||||||||||||||||||||||||||||||||||||||||||||||||||||||||||||||||||||||||||||||||||||||||||||||||||||||||||||||||||||||||||||||||||||||||||||||||||||||||||||||||||||||||||||||||||||||||||||||||||||||||||||||||
* this spool of line was a freebie and when the sellotape was remove it also removed most of the info on the label | ||||||||||||||||||||||||||||||||||||||||||||||||||||||||||||||||||||||||||||||||||||||||||||||||||||||||||||||||||||||||||||||||||||||||||||||||||||||||||||||||||||||||||||||||||||||||||||||||||||||||||||||||||||||||||||||||||||||||||||||||||||||||||||||||||||||||||||||||||||||||||||||||||||||||||||||||||||||||||||||||||||||||||||||||||||||||||||||||||||||||
Welcome!Log into your account


